
Testing Valuation-Based Investing: What the Data Actually Shows
I read Howard Marks’ letters and listen to My First Million pretty regularly. The connection happened when I heard Marks mention that you could build an algorithm to adjust allocations based on valuations, and I thought: “I think I could actually build that.”
Look, everyone knows higher P/E ratios mean lower expected returns. That’s not new. But I’d never seen the data quantified like this - at this specific P/E ratio, expect X return; at that P/E ratio, expect Y return. The precision of it seemed worth testing.
So I decided to code it up and see if the math actually holds. Turns out it does, and the results are pretty compelling.
The JP Morgan Chart That Started Everything
It all began with Howard Marks referencing a JP Morgan study showing that when the S&P 500’s P/E ratio hits 23, the next 10 years typically deliver returns between -2% and +2%. Ouch.
That got me thinking: if valuations are so predictive, why do most of us stick with static allocations like 60/40 or 80/20 regardless of market conditions? It’s like wearing the same clothes whether it’s 20°F or 90°F outside.
So I decided to test this scientifically.
The Data Doesn’t Lie: CAPE Ratios Predict Returns
Using historical data from 1980-2024, I analyzed the relationship between the CAPE ratio (Cyclically Adjusted P/E) and forward returns. The results were eye-opening:
CAPE explains 73.7% of 10-year forward returns.
Let me put that in perspective. In finance, finding anything that explains even 30% of returns is noteworthy. This is a smoking gun.
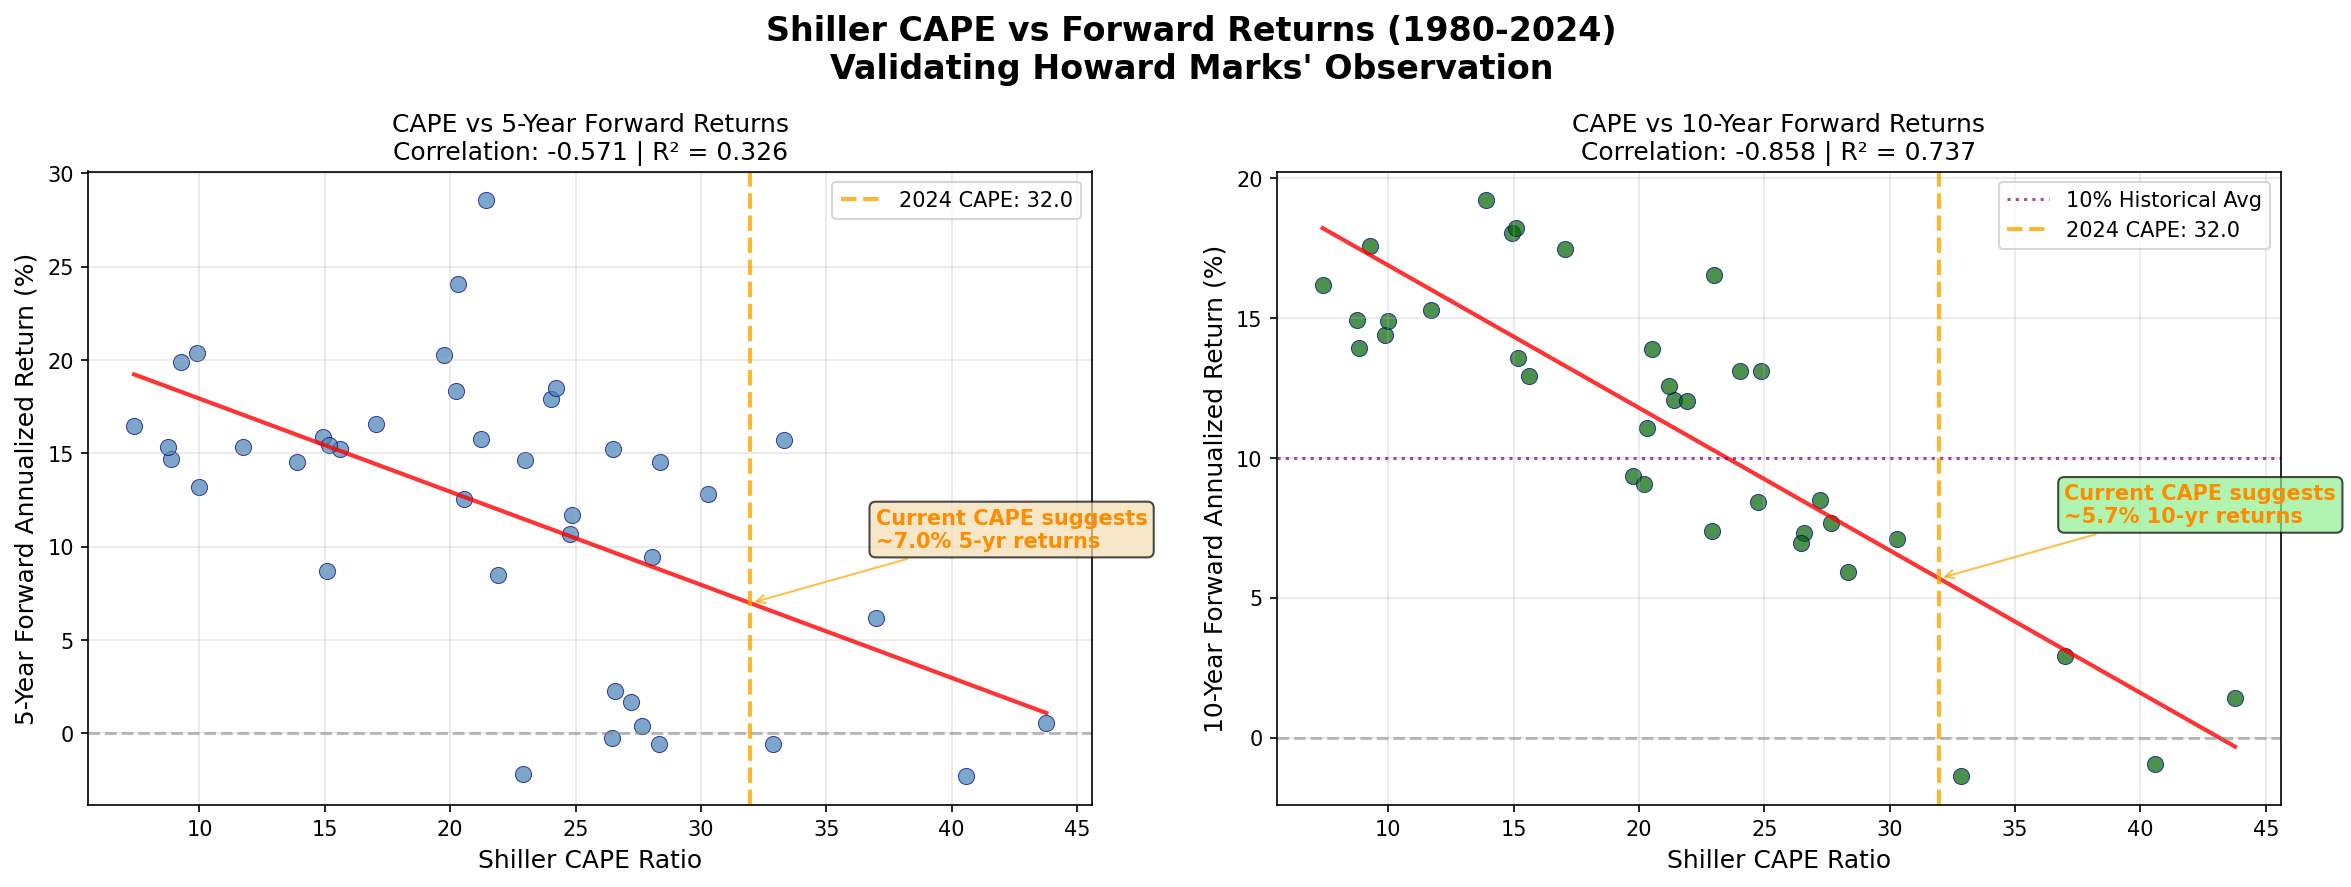
Here’s the simple equation I derived: 10-year return = -0.327 × CAPE + 15.42
Translation: Higher CAPE = Lower future returns (and vice versa).
Building the Valuation-Based Algorithm
Based on this relationship, I built a systematic allocation strategy that adjusts equity exposure based on market valuations:
| CAPE Range | Market Condition | Expected 10yr Return | Equity Allocation |
|---|---|---|---|
| 0-12 | Screaming Buy | 15% | 90% |
| 12-16 | Very Attractive | 12% | 80% |
| 16-20 | Attractive | 10% | 70% |
| 20-25 | Fair Value | 8% | 60% |
| 25-30 | Expensive | 6% | 45% |
| 30-35 | Very Expensive | 4% | 35% |
| 35+ | Bubble Territory | 2% | 25% |
The logic is simple: when stocks are cheap, buy more. When they’re expensive, be defensive.
The Backtest Results Will Surprise You
I tested this against traditional strategies from 1990-2024. Here’s what $100,000 would have grown to:
Winner: Valuation-Based Strategy - $869,012 (in tax-deferred accounts)
- Annual return: 6.57%
- Max drawdown: -29.2%
- Sharpe ratio: 0.89
Runner-up: Tax-Efficient 80/20 - $829,180
- Annual return: 6.42%
- Max drawdown: -37.1%
- Sharpe ratio: 0.73
Traditional 80/20 Buy & Hold - $729,502
- Annual return: 6.02%
- Max drawdown: -37.1%
- Sharpe ratio: 0.73
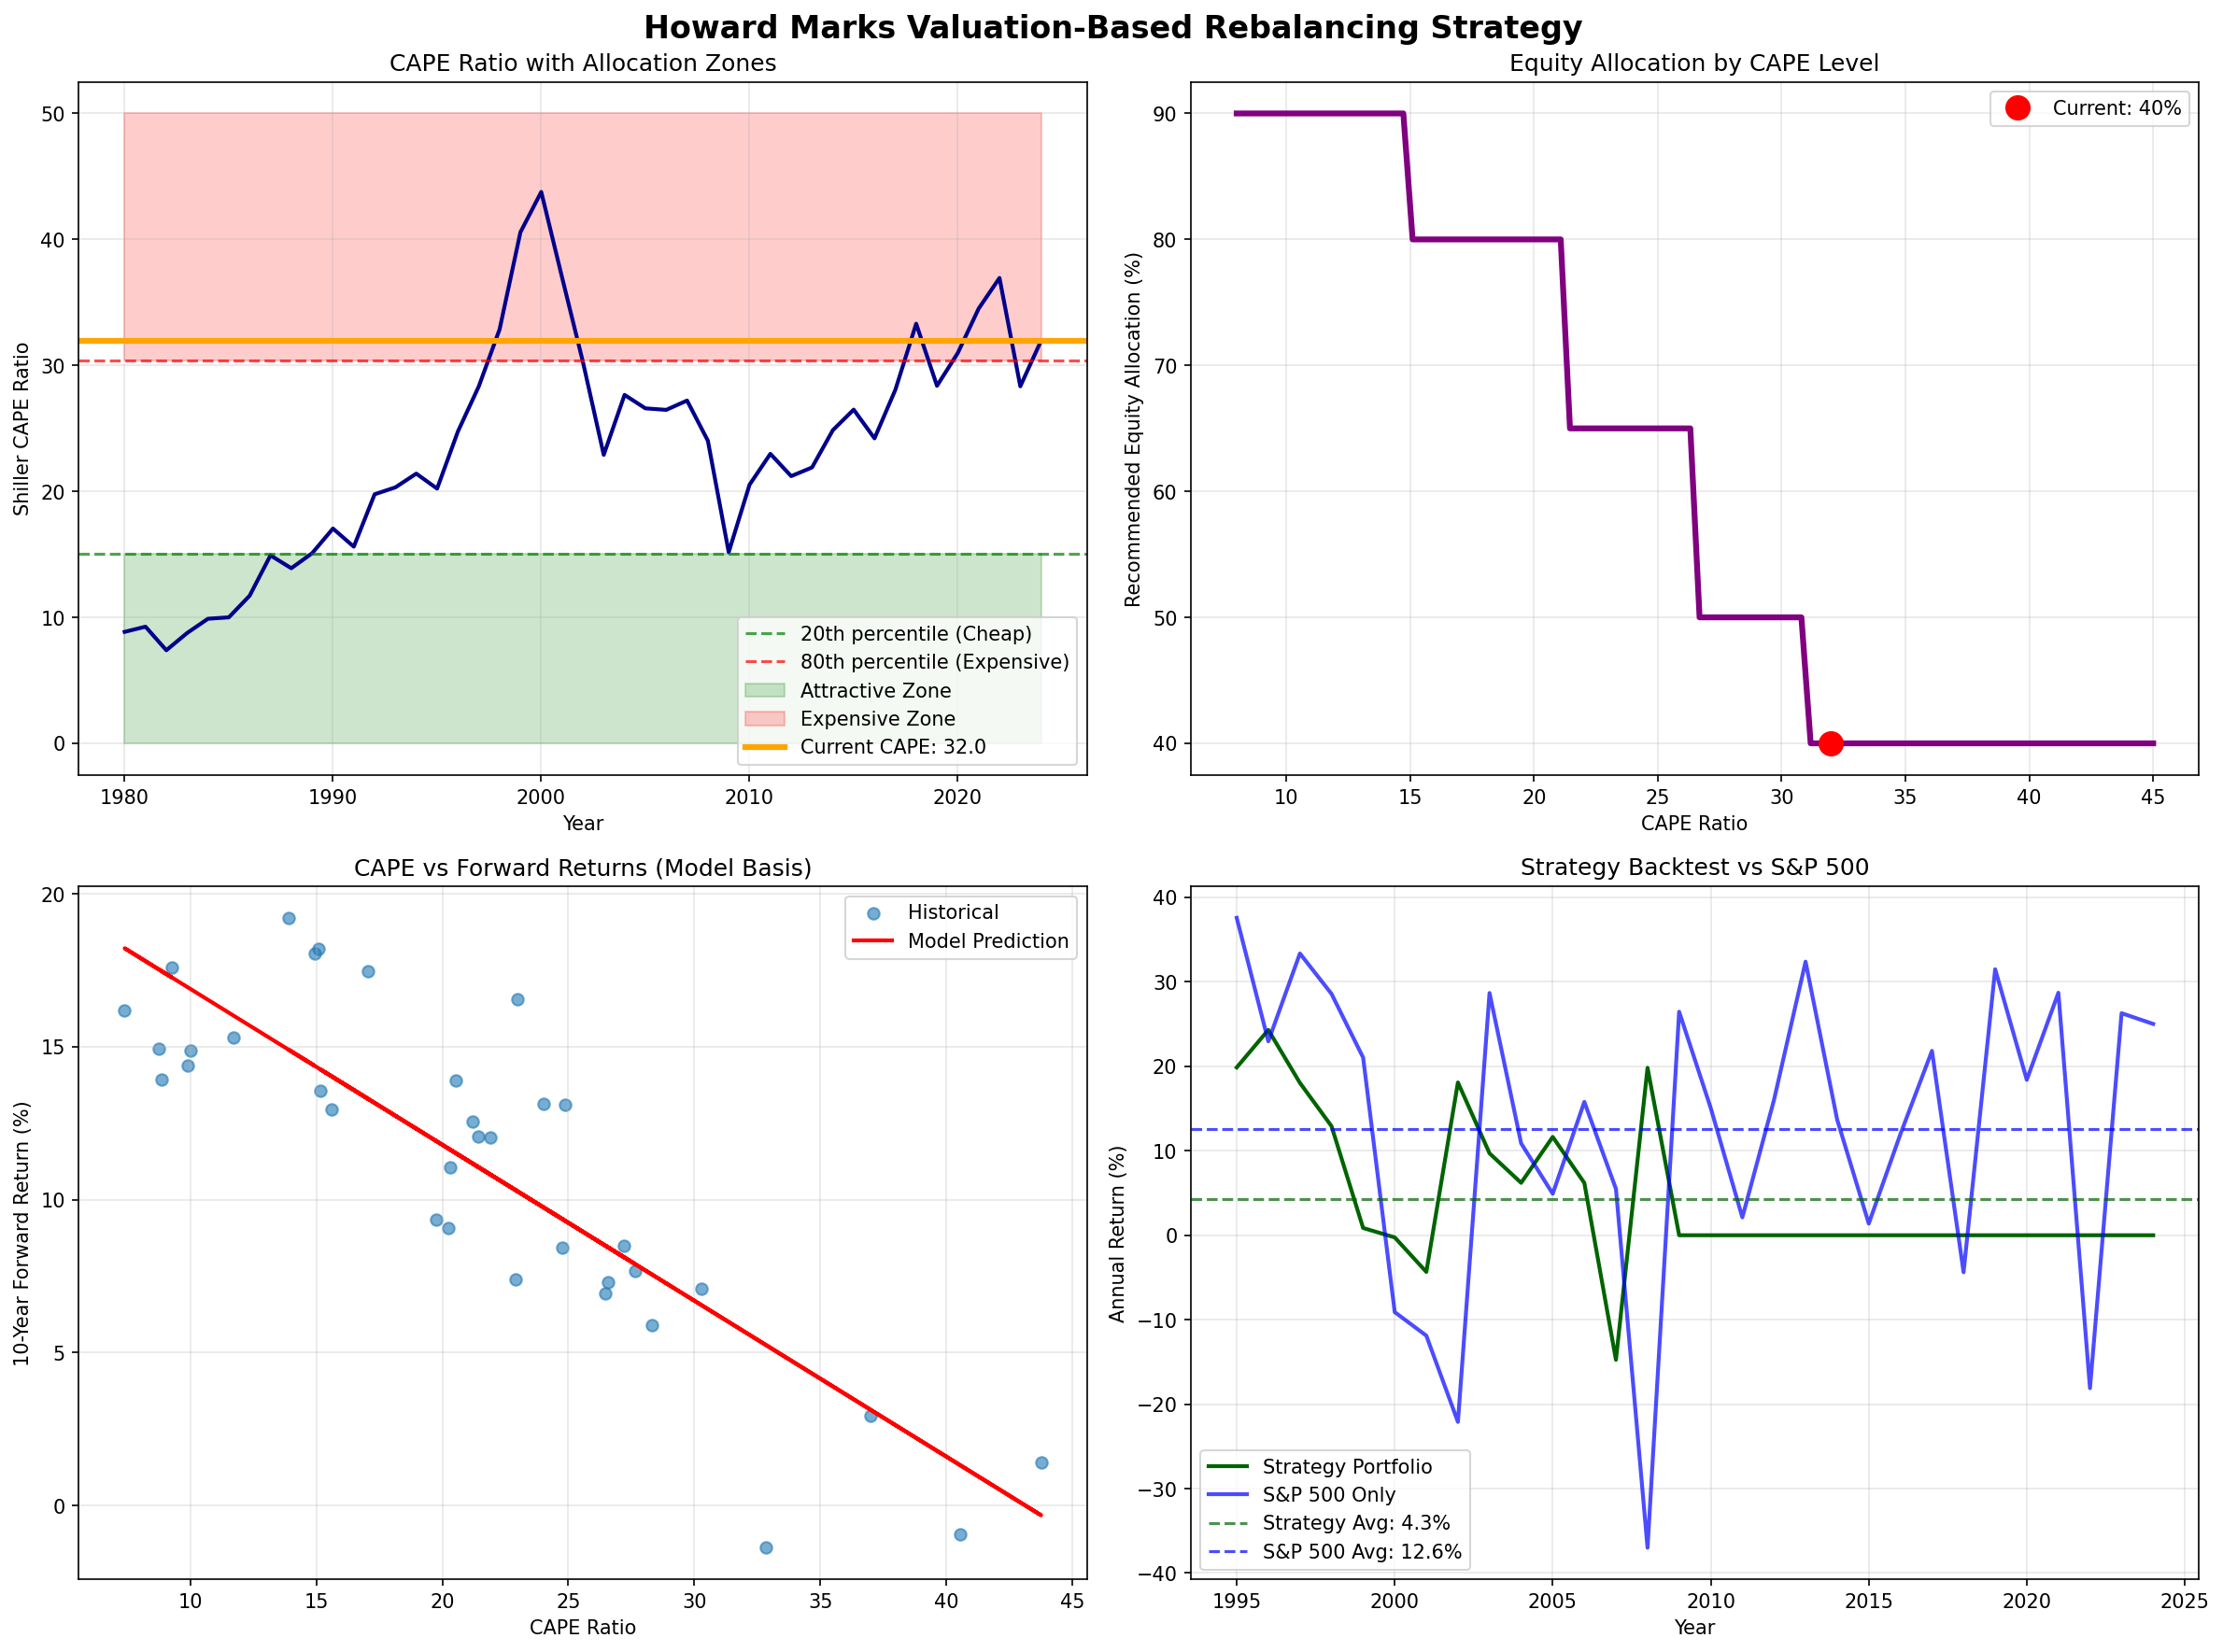
The valuation-based approach delivered higher returns AND lower volatility. That’s the holy grail of investing.
But Wait, There’s a Tax Problem
Here’s where it gets interesting (and where critics have a point). The Howard Marks strategy requires rebalancing, which creates taxable events. In taxable accounts, this hurts.
Tax drag comparison:
- Buy & Hold 80/20: 1.03% annual tax drag
- Howard Marks: 1.67% annual tax drag
However, even with the higher tax cost, the Howard Marks approach still wins in taxable accounts by $30,000+ because the better risk-adjusted returns overcome the tax penalty.
The real magic happens in tax-deferred accounts (401k, IRA) where there’s no rebalancing penalty. There, Howard Marks crushes buy-and-hold by $139,510.
Why This Matters Right Now
Here’s the kicker: today’s CAPE ratio is above 40 — in bubble territory, more expensive than 98% of all readings since 1881.
According to the model, this suggests 10-year forward returns around 2% for traditional stock-heavy portfolios. The Howard Marks approach would currently allocate just 25% to stocks — maximum defensive positioning.
This isn’t market timing in the day-trading sense. It’s recognizing that when you’re paying 40x cyclically-adjusted earnings, you’re probably not going to get great returns. History strongly supports this view.
The Practical Takeaway
So what should you actually do? Here’s my recommendation based on the analysis:
If you have tax-deferred accounts (401k, IRA):
- Use the full Howard Marks dynamic strategy
- Monitor CAPE monthly (it’s free online)
- Rebalance when CAPE moves 3+ points
- Currently: ~25% stocks, ~75% bonds/alternatives (CAPE above 40 = bubble territory)
If investing in taxable accounts:
- Consider tax-efficient 80/20 if you want simplicity
- OR use Howard Marks with tax optimization:
- ETFs only (more tax-efficient)
- Tax-loss harvest regularly
- Rebalance with new money first
Current environment (CAPE above 40):
- Be very defensive - the model suggests maximum caution at these valuations
- Focus on quality - profitable companies, dividend payers
- Consider alternatives - Treasury yields around 4% look attractive relative to expected equity returns of ~2%
The Uncomfortable Truth
The hardest part about this strategy isn’t the math - it’s the psychology. Right now, the model says to be defensive when everyone else is bullish. In 2009, it would have said to be aggressive when everyone was panicking.
That’s exactly when it works best.
The beauty of having a systematic approach is that it removes emotion from the equation. You’re not trying to predict what will happen next month. You’re simply acknowledging that expensive markets tend to deliver poor long-term returns, and positioning accordingly.
Final Thoughts
After diving deep into the data, I’m convinced Howard Marks is onto something profound. The relationship between valuations and forward returns is too strong to ignore.
This doesn’t mean abandoning buy-and-hold entirely - it still has merits, especially the tax efficiency. But for the majority of your money (especially in tax-deferred accounts), a valuation-aware approach makes mathematical sense.
The next time someone tells you “time in the market beats timing the market,” you can respond: “Actually, the data suggests that intelligent allocation adjustment based on valuations beats both.”
Just make sure you can stick with it when it feels uncomfortable. That’s exactly when it works best.
Key Takeaways and Considerations
While this valuation-based approach shows compelling historical results, it’s important to consider both its strengths and limitations:
What Works Well:
- Systematic approach removes emotional decision-making
- Margin of safety applied to asset allocation
- Follows basic investment prudence - don’t overpay for assets
- Focuses on avoiding major mistakes rather than hitting home runs
Important Considerations:
- False precision risk - correlations can break down when you need them most
- Timing challenges - markets can stay overvalued longer than expected
- Psychological difficulty - you’ll underperform during extended bull markets
- Implementation discipline - requires patience during periods of underperformance
Practical Implementation Tips:
- Use CAPE as one input, not gospel - don’t over-rely on any single metric
- Phase in changes gradually - avoid dramatic allocation swings
- Prepare mentally for periods when this strategy looks wrong
- Remember you’re an investor, not a trader - focus on long-term ownership
The strategy has merit, but success depends as much on psychological discipline as mathematical precision.
Want to try it yourself? I threw together a tool that does all this math for you. Here it is running live:
Pretty handy for checking where we are in the cycle without getting swept up in whatever the market’s doing that day.
Disclaimer: This is educational analysis, not investment advice. Past performance doesn’t guarantee future results. Consider consulting with a qualified financial advisor.
References & Data Sources
Primary Data Sources:
- Robert Shiller’s CAPE Data - Yale University Economics Department
- Current CAPE Ratio - Real-time market valuations
- JP Morgan Guide to the Markets - PE ratio and forward returns analysis
- S&P 500 historical returns data (FRED Economic Data)
- Federal Reserve Economic Data (FRED)
Key References:
- Howard Marks - Co-founder and Co-Chairman, Oaktree Capital Management
- Oaktree Capital Insights & Memos - Howard Marks’ investment philosophy
- My First Million Podcast - Investment and business insights
- Howard Marks Investment Discussion - Video analysis
Analysis Period: 1980-2024
Methodology: Historical backtesting using Python with pandas, numpy, and matplotlib for data analysis and visualization.