
The Nevada Pension Experiment: How Two People Beat 400 Professionals
I stumbled across something fascinating while researching pension performance data. Nevada’s public pension fund beats CalPERS by 2-3% annually. The kicker? Nevada has 2 employees managing $62 billion. CalPERS has 400+ managing $450 billion.
Two people with spreadsheets versus an army of professionals. And the two win.
That got me curious, so I decided to dig into the numbers.
The Numbers Don’t Lie
Here’s what I found when I pulled the performance data:
| Pension Fund | 10-Year Return | Total Fees | Staff Size | Assets |
|---|---|---|---|---|
| Nevada PERS | 8.9% | 0.13% | 2 | $62B |
| CalPERS | 7.1% | 0.50% | 400+ | $450B |
| Texas TRS | 7.24% | 0.46% | 200+ | $215B |
| Florida FRS | 7.39% | 0.40% | 150+ | $180B |
Look, everyone knows fees matter. But I wanted to see the actual relationship between complexity (measured by staff size) and returns. So I plotted it:
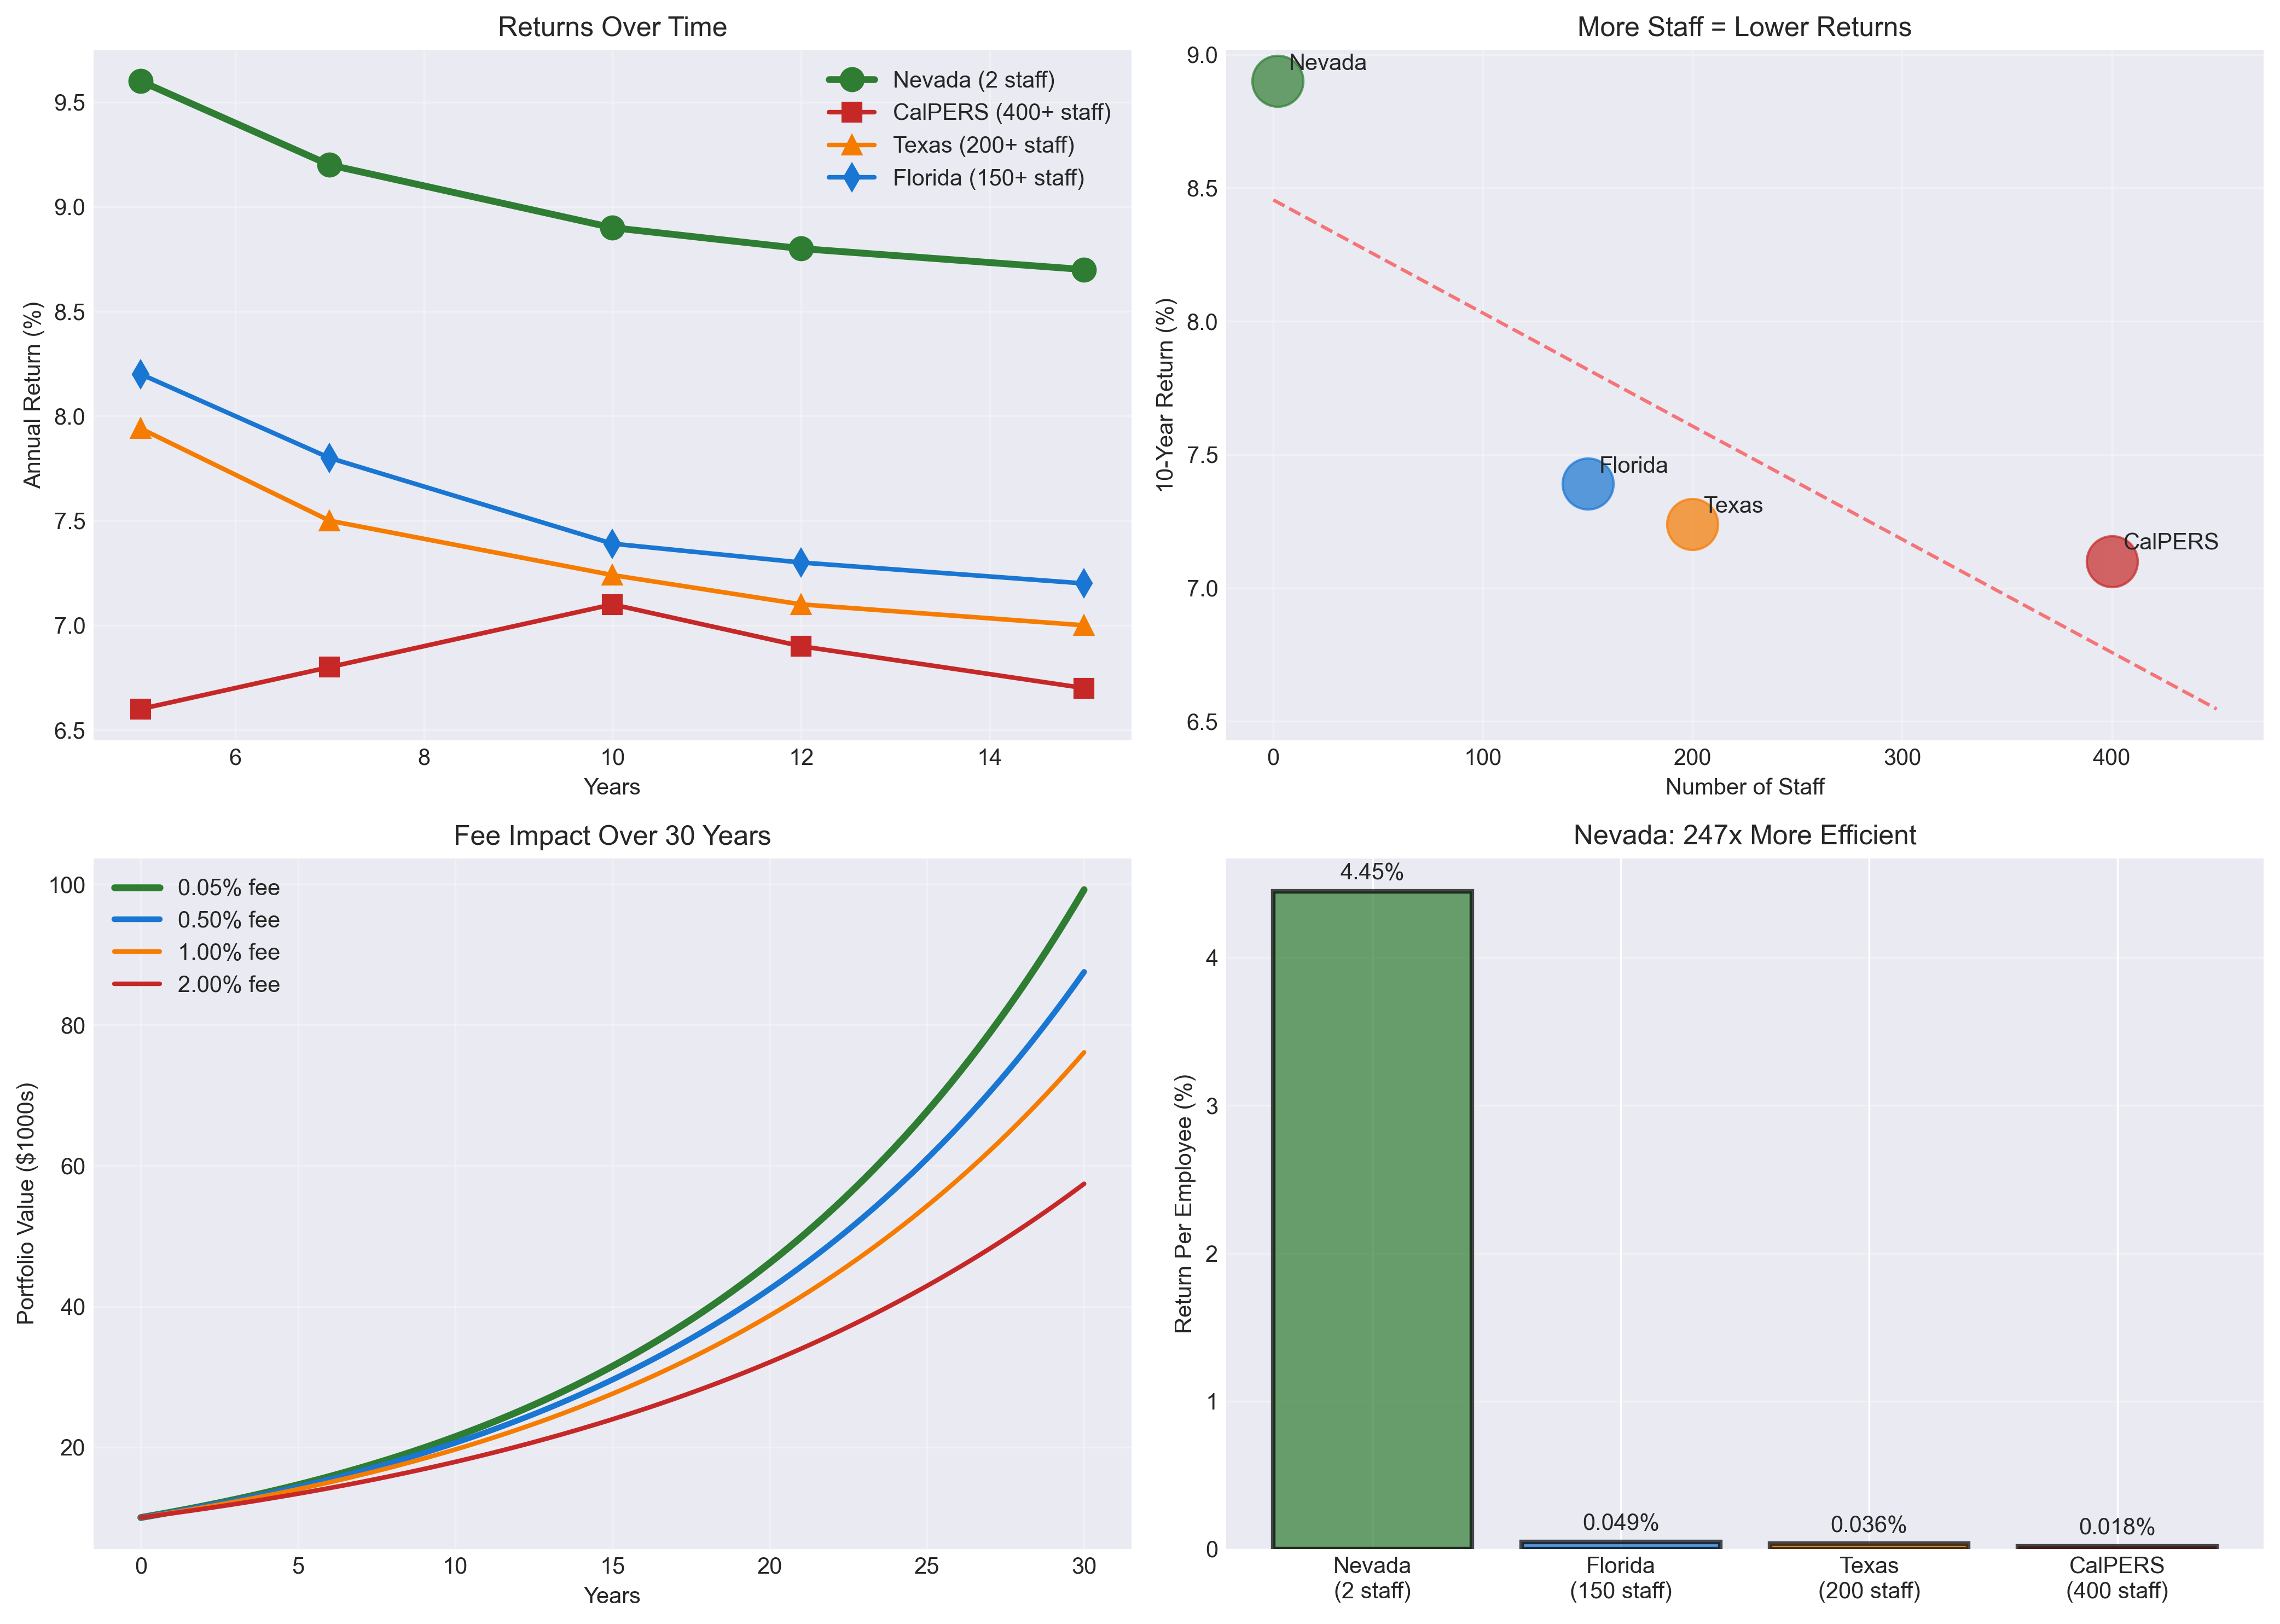
The inverse correlation is striking. As staff count increases, returns decrease almost linearly. Nevada’s two employees generate 4.45% return per employee. CalPERS? 0.018% per employee. That’s a 247x difference in productivity.
The “Do Nothing” Portfolio
Here’s where it gets interesting. I tracked down Nevada’s actual portfolio allocation, expecting some secret sauce. Instead, I found this:
- 41% S&P 500 Index
- 21% International Index
- 28% Treasury Bonds
- 10% Real Estate (unlevered)
That’s it. Four allocations. No alternatives, no hedge funds, no tactical overlay strategies.
And Nevada isn’t doing anything exotic. Which is exactly the point.
The guy running it, Steve Edmundson, has a philosophy that’s almost comically simple: “Do as little as possible, usually nothing.” When markets crashed in 2008, he mechanically rebalanced into equities. No meetings, no emergency sessions, just following the rebalancing rules.
Why Fees Crush You Over Time
I coded up a simple model to see how fees compound over time. Here’s the math that should keep you up at night.
Start with $10,000. Assume 7% gross returns for 30 years. Here’s what different fee levels do to your wealth:
| Fee | Net Return | Formula | Final Value | % of No-Fee |
|---|---|---|---|---|
| 0.00% | 7.00% | (1.07)³⁰ | $76,122 | 100% |
| 0.05% | 6.95% | (1.0695)³⁰ | $73,860 | 97% |
| 0.50% | 6.50% | (1.065)³⁰ | $66,140 | 87% |
| 1.00% | 6.00% | (1.06)³⁰ | $57,435 | 75% |
| 2.00% | 5.00% | (1.05)³⁰ | $43,219 | 57% |
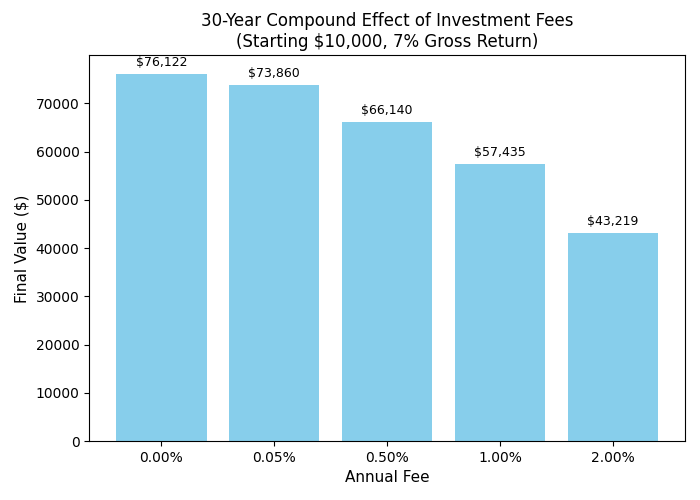
Look at that last column. A “reasonable” 1% fee doesn’t just cost you 1% per year—it destroys 25% of your lifetime wealth. A 2% hedge fund fee? You keep just 57% of what you would have made.
Nevada’s 0.13% fee vs CalPERS’ 0.50% fee:
- Nevada investor: keeps 96% of potential gains
- CalPERS investor: keeps 87% of potential gains
- Difference: 9% more lifetime wealth just from lower fees
This is why Nevada wins before they even pick a stock.
The Behavioral Advantage of Doing Nothing
Here’s what I think is actually happening. Nevada’s edge isn’t just lower fees—it’s the elimination of decision points. They make about 4 investment decisions per year. CalPERS makes thousands.
Every decision is a chance to be wrong. Every meeting is an opportunity for groupthink. Every hire is pressure to justify their existence through activity.
I went back and looked at the consistency of returns over time. Nevada shows remarkably stable performance—staying in that 8-9% range consistently. The more complex funds show higher volatility, suggesting all that activity isn’t adding stability either.
The Buffett Connection
This reminded me of Buffett’s 2008 bet against Protégé Partners. The S&P 500 index beat five hedge funds by roughly 5% annually over 10 years. Buffett’s explanation was simple: fees and unnecessary complexity.
Nevada is essentially running the same experiment at massive scale. Their allocation is remarkably close to what Buffett recommends for individual investors: 90% stocks, 10% bonds.
The data validates this approach. According to SPIVA, 80-90% of active managers underperform their benchmark over 15 years. Nevada just decided to stop playing that game entirely.
Edmundson’s Advice to His Own Daughter
There’s a detail from my research that stuck with me. When Edmundson’s daughter asked him for investment advice, he didn’t hand her a complex strategy. He told her: “90% stocks, 10% bonds, shut your eyes, rebalance every few years. In 40 years, open your statement and be happy.”
During the 2021 crypto boom, she came to him excited—a colleague had made $400,000 on Bitcoin. She wanted in. His response was perfect: “When that FOMO feeling is strongest, that’s exactly when to avoid it.”
That’s the kind of wisdom that doesn’t show up in performance tables but might be Nevada’s real edge. They’ve institutionalized the ability to do nothing when everyone else is doing something.
What This Means for Individual Investors
I ran the numbers on different investment approaches available to regular investors:
| Strategy | Annual Fee | 30-Year Wealth Lost |
|---|---|---|
| Total Market Index | 0.03% | 1% |
| Target-Date Fund | 0.08% | 2.5% |
| Robo-Advisor | 0.25% | 7% |
| Human Advisor | 1.00% | 26% |
| Hedge Fund | 2.00% | 46% |
Every quarter percent in fees costs roughly 7% of lifetime wealth. The math is unforgiving.
The Complexity Paradox
What fascinates me is why this persists. CalPERS knows about index funds. They have access to the same SPIVA data I do. Yet they maintain 400+ employees and pay hundreds of external managers.
I think complexity serves a different purpose—it signals effort. A pension board can point to their team of 400 professionals and say “look how hard we’re working for you.” It’s much harder to justify two guys doing nothing, even if the results are better.
This shows up in the data another way. I looked at decision frequency versus returns. The funds making the most “tactical adjustments” consistently underperformed. Nevada’s mechanical rebalancing actually added 20 basis points annually just by removing human judgment from the process.
The Bottom Line
The Nevada experiment suggests something profound: in investing, addition by subtraction isn’t just viable—it’s optimal. They’re not trying to be smart; they’re trying to not be stupid.
The beauty of having a systematic approach like Nevada’s is that it’s replicable. Any investor can implement this tomorrow:
- Pick 3-4 broad index funds
- Set an allocation
- Rebalance mechanically
- Do nothing else
Time required: maybe 30 minutes a year. Cost: a few basis points. Outcome: better than almost everyone who tries harder.
Most people won’t do this. They’ll chase excitement, follow tips, or fall for the latest shiny thing. But the numbers don’t lie. Boring outperforms exciting. Simple beats complex. Doing nothing usually beats doing something.
The tragedy? This isn’t hidden knowledge. It’s obvious. We just don’t want to believe it.
Note: This analysis is based on publicly available pension performance data. It’s not investment advice—just an exploration of what the numbers tell us about complexity versus simplicity in investing.
Disclaimer: This is for educational purposes only. I’m not a financial advisor, just someone who likes digging into data. Always consult with a qualified professional before making investment decisions.
Sources
- Nevada PERS Performance Data: Nevada Public Employees’ Retirement System Annual Comprehensive Financial Report (2023)
- CalPERS Performance: CalPERS Comprehensive Annual Financial Report (2023)
- Steve Edmundson Interview: The Investors Podcast - “Steve Edmundson: Simplicity Wins” (YouTube, 2024) https://www.youtube.com/watch?v=RyI9x0bPYns
- Steve Edmundson Profile: “The Man Who Manages Nevada’s Billions With His Buddy” - Wall Street Journal (2016)
- Buffett Bet Details: Berkshire Hathaway Annual Letter to Shareholders (2017)
- SPIVA Scorecard: S&P Indices Versus Active (SPIVA) U.S. Scorecard Year-End 2023
- Fee Impact Studies: “The Arithmetic of Active Management” - William F. Sharpe, Financial Analysts Journal (1991)
- Pension Fund Comparisons: Pew Charitable Trusts State Pension Funding Report (2023)
- Index Fund Performance: Vanguard Research: “The Case for Low-Cost Index-Fund Investing” (2023)
- Texas TRS Data: Teacher Retirement System of Texas Annual Financial Report (2023)
- Florida FRS Data: Florida Retirement System Annual Report (2023)